Francois Marie Raoult
(1830 - 1901)

|
Francois Marie Raoult |
|
|
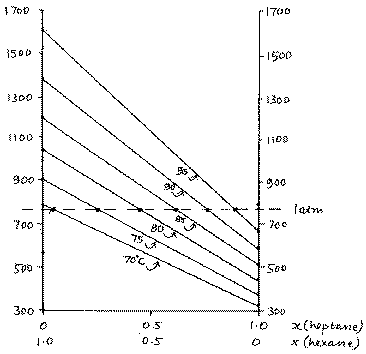
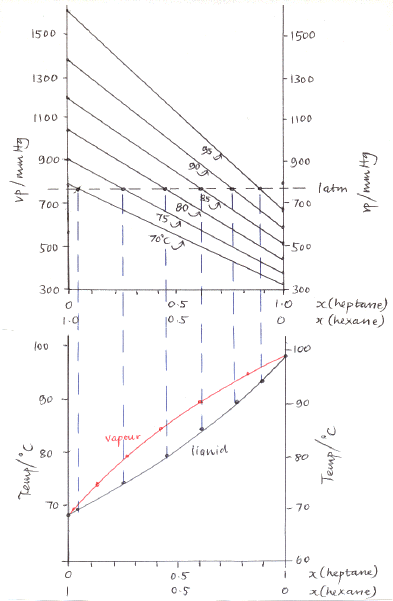
If you have studied Raoult’s Law you will be familiar with the graph of vapour pressure vs composition at constant temperature. You will probably also be familiar with the boiling point/composition diagram (at constant pressure) that is used to explain fractional distillation. What is often absent from the books is the link between the two diagrams. Here it is. As temperature increases, so does the vapour pressure of a liquid. The vapour pressure/ composition diagram is plotted at constant temperature; a series of these plots at different temperatures (fig 1, right) is needed in order to obtain a boiling point/composition diagram. The graph shown is for a mixture of hexane and heptane, which forms an ideal liquid mixture. Since vapour pressure does not increase linearly with an increase in temperature, the vapour pressure lines at the different temperatures are not parallel. Boiling-point composition diagrams are usually plotted at atmospheric pressure, though for an ideal liquid mixture they’d look more or less the same whatever the chosen pressure. The horizontal line is at 1 atm (760 mmHg), and gives the composition of the liquid that gives rise to a vapour pressure of 1 atm at each temperature. |
Fig 1: vapour pressure of hexane/heptane mixtures at various temperatures |
| The points thus generated are then
transferred to axes having the same composition scale but whose vertical axis is the
temperature (fig 2). The full-size diagram can be seen here. The boiling point/composition diagram is now completed by putting in the line that represents the vapour composition (shown in red). The vapour in equilibrium with liquid at a given temperature is always richer in the more volatile component. Thus the vapour composition is shown by a point at the same temperature, but whose composition is nearer to the more volatile (lower boiling temperature) constituent. The link between the vapour pressure/composition and boiling temperature/composition diagrams for non-ideal (azeotropic) mixtures is the same, but such systems give a more complex diagram because of the vapour pressure maximum or minimum. |
Fig 2: The link between the vp/composition and bp/composition diagrams. |